
See beyond the invoice. Know what you actually make.
Income, expenses, chemical costs and labor in one place, with a dashboard that shows profit against your goals, two kinds of profit and loss, tax reports that drill down to the line, and exports your accountant will thank you for.
Included in every plan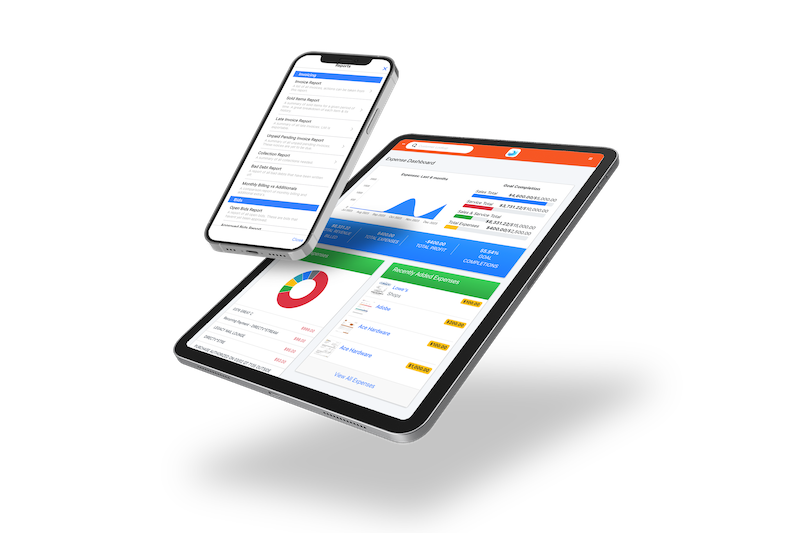
The numbers a pool company runs on.
Chemical cost per pool, per tech, per dose
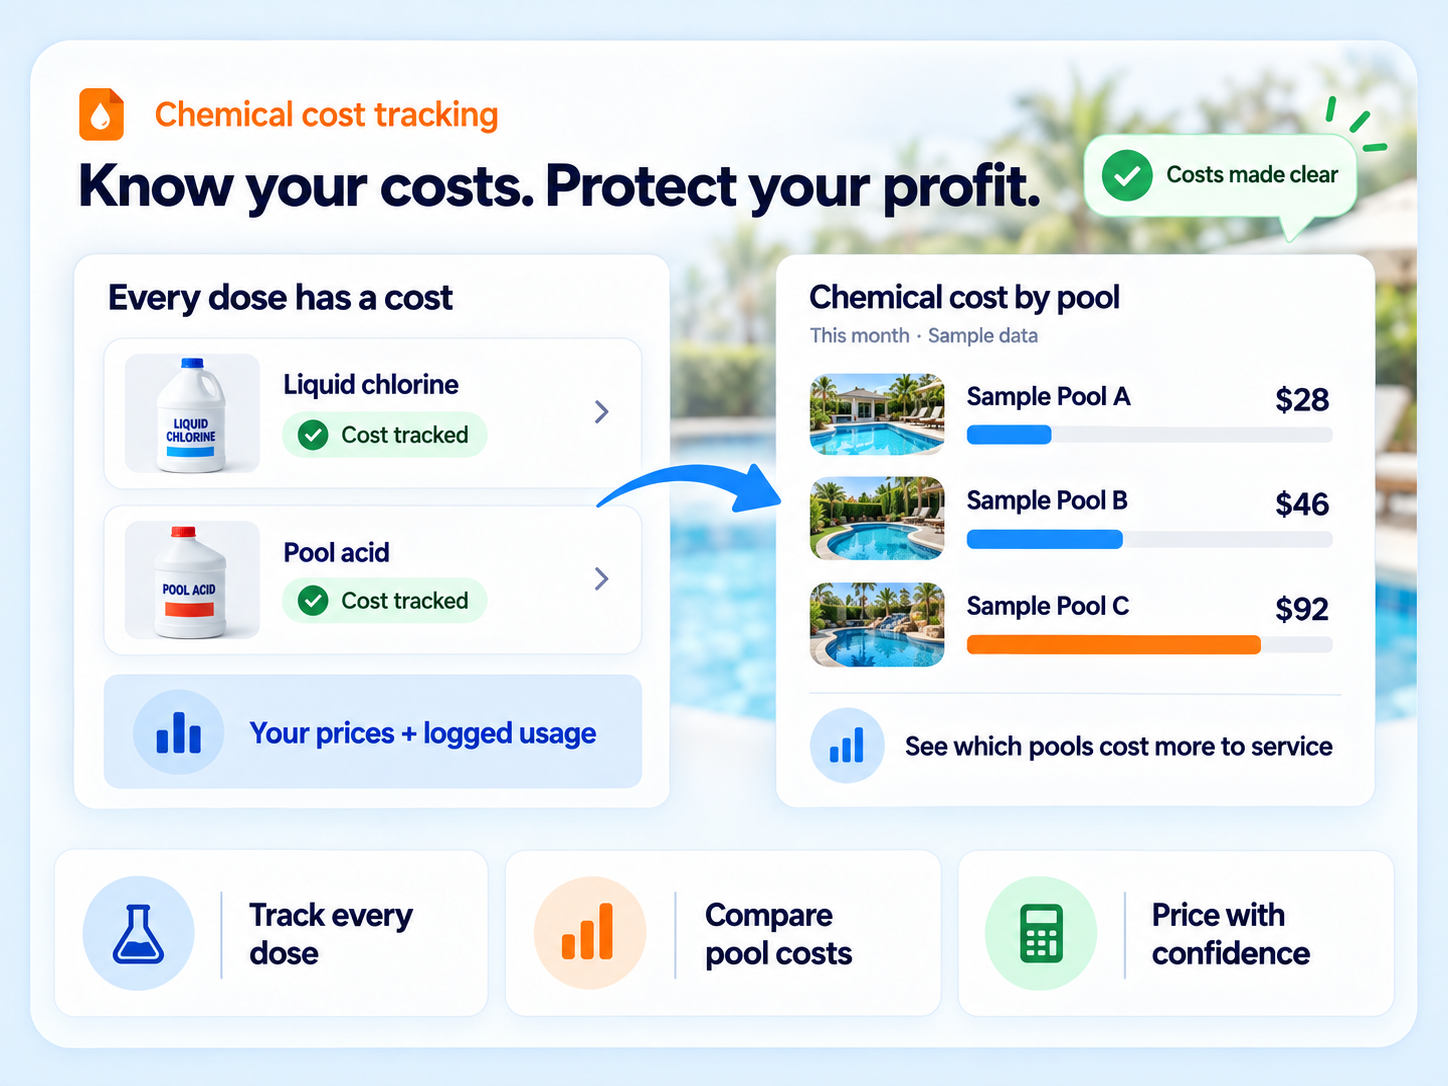
Liquid chlorine, tabs, acid, cal-hypo, salt, soda ash, phosphate remover, enzymes, clarifier and more, costed automatically from the doses your techs log. Find the account that has quietly lost money for a year and the tech using twice the acid.
Profit per customer
Chemical cost per customer, your worst-cost customers, and cost by technician, so you know exactly which accounts and routes make money and which to reprice.
Expense Dashboard
Total profit, total revenue, expenses for the year, your top six expense categories as a chart, recent expenses and a trend line.
Profit and loss, two ways
Cash-based P&L for how you run the business, accrual P&L for how your accountant sees it.
Tax reports with drill-down
Sales Tax and Services Tax reports, each with an audit view of the invoice lines behind every total.
Income goals
Set a goal and watch year-to-date progress, split by sales and service.
Exports your accountant will love
xlsx, csv, txt or pdf, or emailed to you. Field and office expense logging with vendor, category, receipt photo and tags.
Thirty-plus reports
Collection, Bad Debt, Late Invoice, Unpaid Pending, Negative Balance, Monthly vs Additionals, Sold Items, Approved and Open Bids, Labor, Filter Cleaning, Low Chlorine and more.
From receipt to tax return.
Capture spending
Techs snap receipts in the field. The office imports the bank feed. Chemicals are costed as they're logged.
Categorize
Auto-assign handles most rows. Tag and fix the rest.
Watch the dashboard
Profit, revenue versus goal, and top expenses update as the month goes.
Close the year
Run cash or accrual P&L and the tax reports, export, and send to your accountant.
Chemical cost is where pool profit hides
Most pool software knows what you charged. Paythepoolman also knows what each dose cost, per chemical, per pool, per technician. That is how you find the account that has been losing money for a year and the tech who uses twice the acid.
- Chemical price list you maintain
- Doses converted to ounces automatically
- Chemical usage, cost and charging reports
- Custom chemicals supported alongside the standard list
Expense tracking is a $199 upgrade at Jobber. Here it's included.
Jobber lists expense tracking only on its Grow plan. Skimmer and Pool Brain list chemical cost tracking but not income and expense records, P&L or tax reports. Pool Office Manager lists none of these. Paythepoolman includes all of it at $50 plus $15 per technician.
"Love the app and the company. If they charged five times as much I would still be in, but they're much better priced and more responsive than their competitor."
Ryan Hearon, pool service ownerFinancial records FAQs
Can I see profit, not just revenue?
Yes. The Expense Dashboard shows total profit, total revenue, expense count for the year, your top six expense categories, recent expenses, a trend line, and year-to-date progress against income goals split by sales and service.
Does it do profit and loss?
Yes, two ways: a cash-based P&L and an accrual P&L, so you and your accountant can each see the version you need.
How does chemical cost tracking work?
Set your chemical prices once. Every dose a technician logs is converted to ounces and costed for more than 20 chemicals. Reports show chemical cost per customer, your highest-cost customers, and cost by technician.
Can I export for my accountant?
Yes. Export to xlsx, csv, txt or pdf, or have a copy emailed to you. Sales Tax and Services Tax reports include a drill-down to the invoice lines behind every total.
Works hand in hand with
Find out which pools are making you money.
Thirty days free. Talk to a pool pro, not a ticket queue.